This mind-blowing video about the logistic map - a simple equation which finds itself in many different contexts - was one of the most fun and interesting I've had the chance to work on!
We published the code for all the video's custom visuals on GitHub open source, so please go play with it! → Github Repository
Mandelbrot Set x Logistic Map
A fractal revealed beneath another fractal!
The origin of this animation was some tiny low-resolution jpg we found while researching a different video, which showed the logistic map underneath the mandelbrot set. After reading the webpage it came from (literally made in the late 90s) we understood what was going on: the number of iterations taken by the mandelbrot set at any point reveals the logistic map! 🤯
I made a small Jupyter Notebook to do the basic calculations and render the output as a 3D volumetric rendering (using a tool typically used for MRI scans), and it revealed the same basic structure immediately!
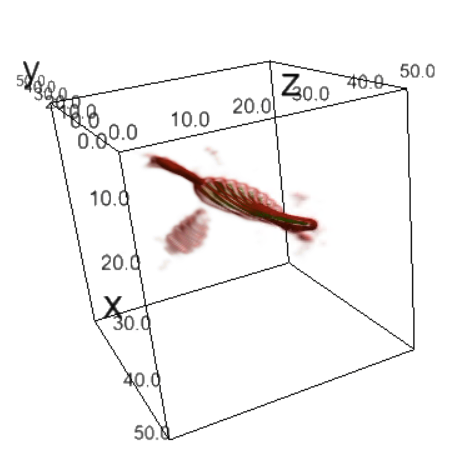
Scaling up the rendering from a 100x100x100 cube of voxels to 1000x1000x1000 cube of voxels (1000x more data!) was a major computing challlenge, but thanks to lots of RAM, parallel CPU cores, and Python's powerful numba package, it could be done quickly!
I used the python library vispy for the volume rendering at that final scale, which was completely non-interactive and would freeze my PC while rendering - well worth it though, especially as the animation still stands proudly on the Wiki for the Mandelbrot set
Logistic map explorative UI
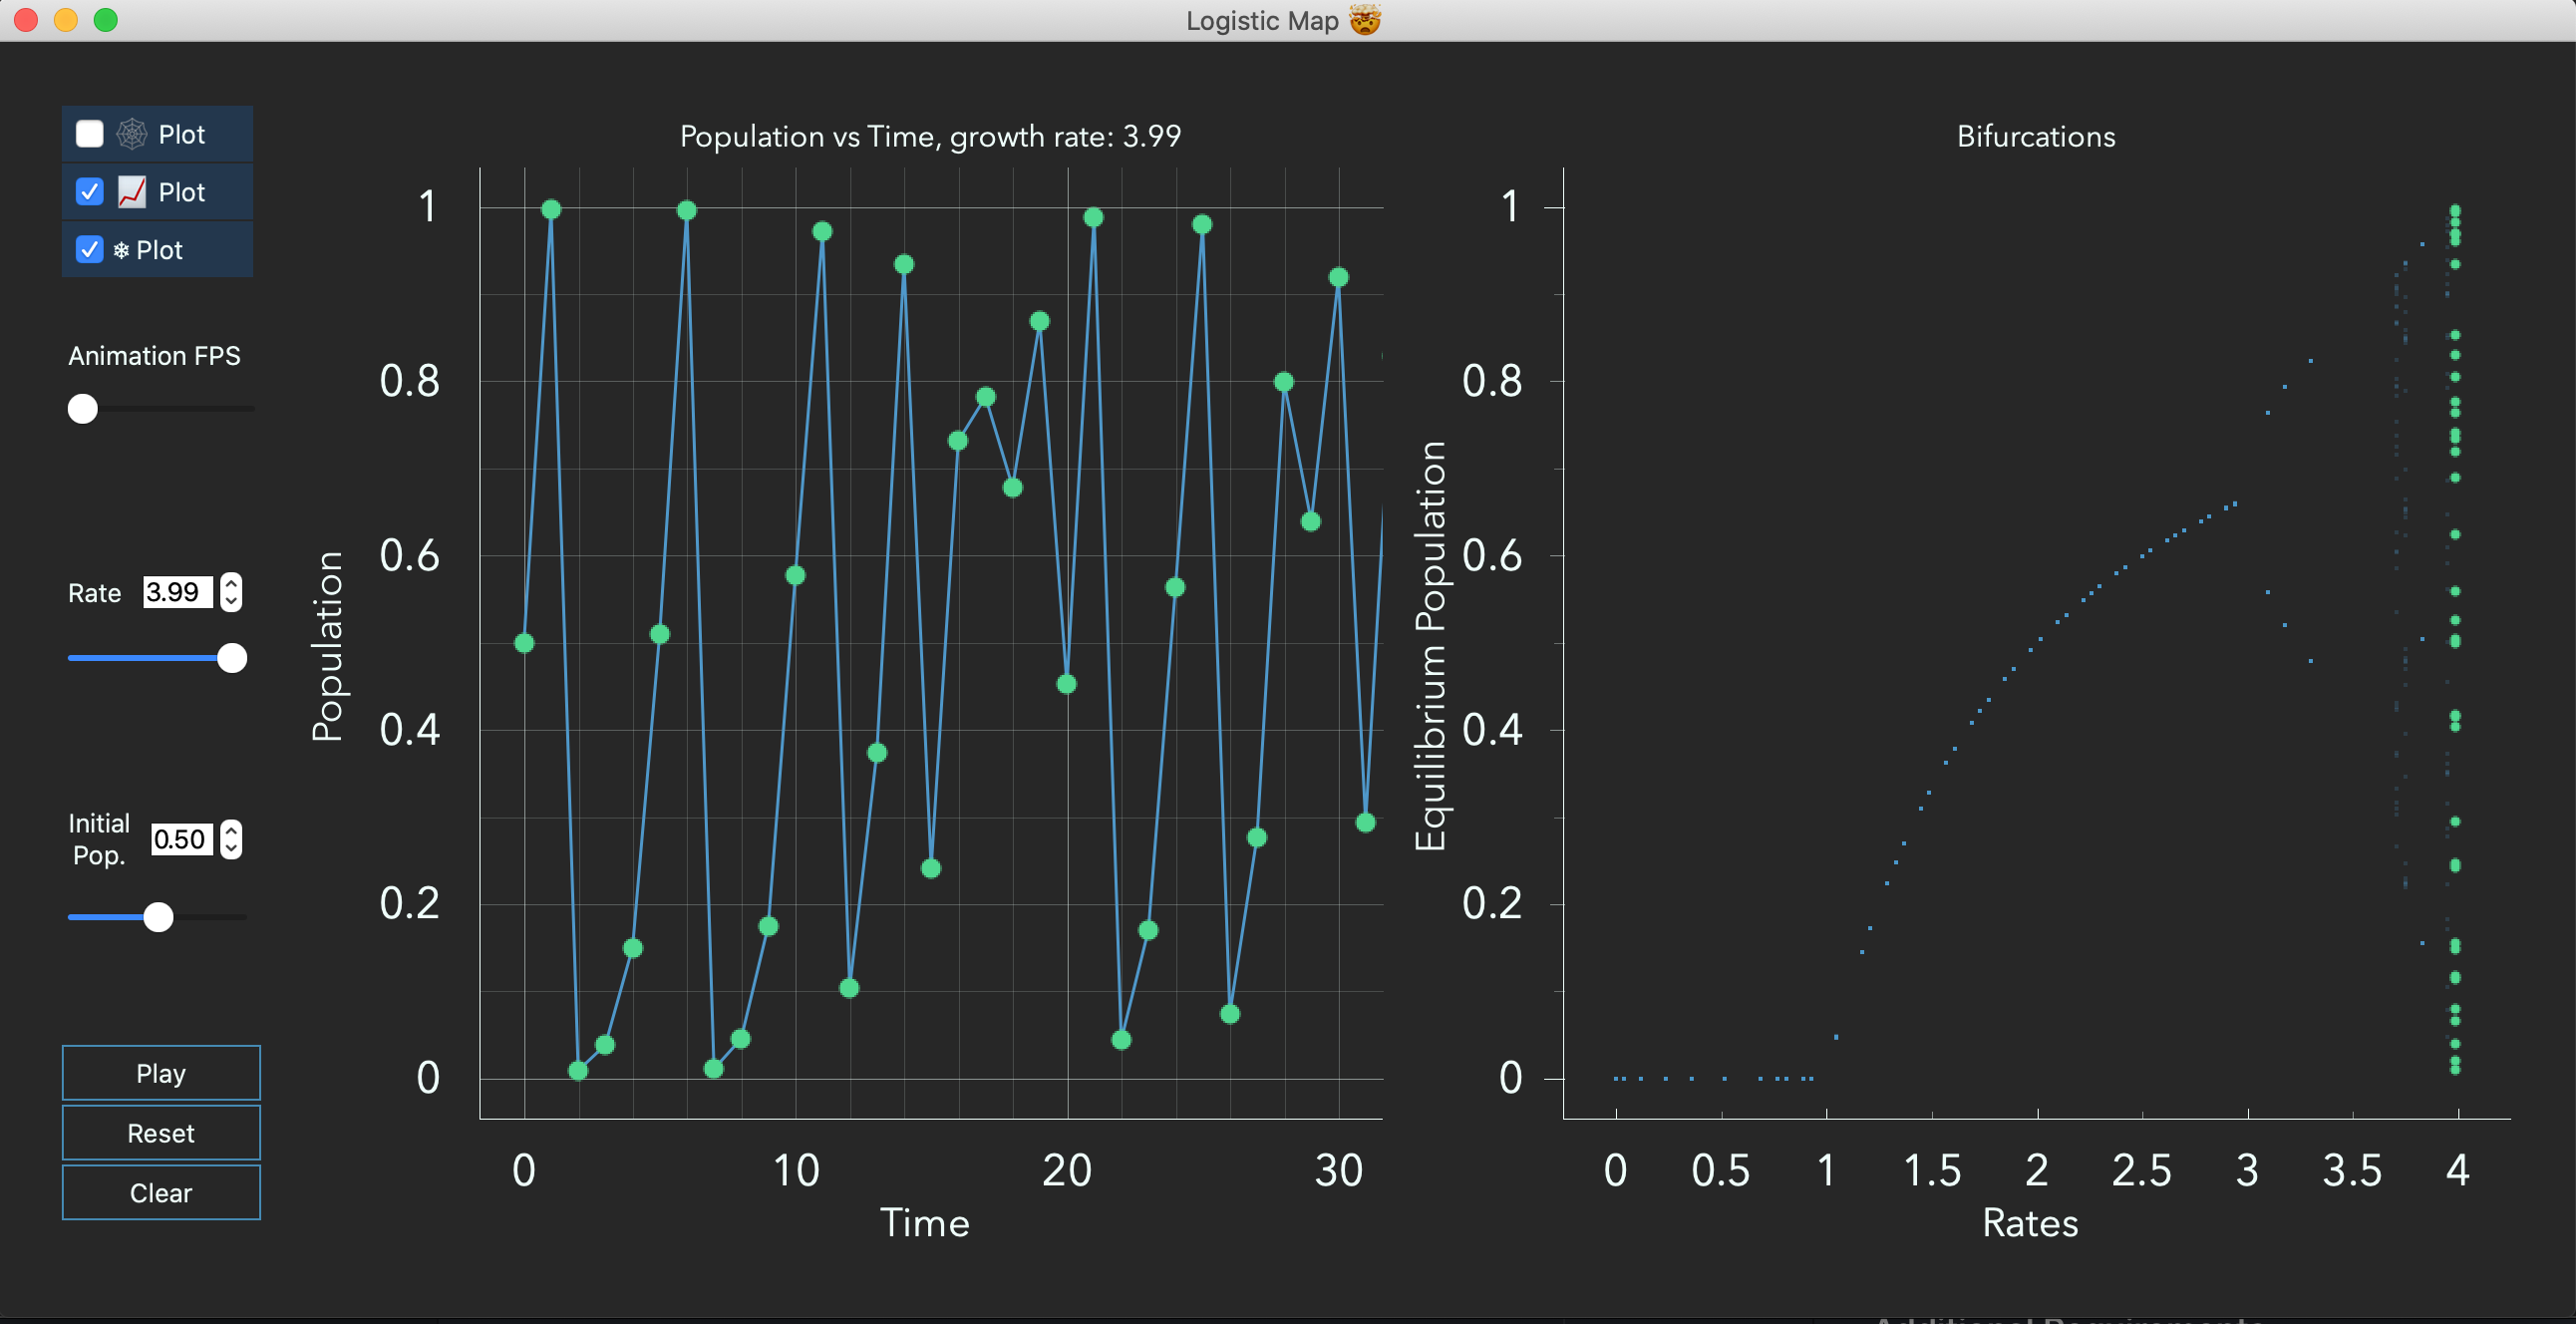
I've always been drawn to interactives as a pedagogical tool, and this piece of the video felt very natural to me. We needed to see the logistic map in multiple different ways, and see the connection between those different views. This little piece of PyQtGraph UI I think really aided in viewer retention and making the explanation more understandable!
Logistic map - deep zoom
This visual was made by rendering the most sickeningly-large scatterplot you can imagine, with ~20,000,000 points rendered per frame
That many points was crucial to getting the structure of the fractal in its full glory, especially at the deeper zoom levels, but oh my goodness did it take a long time to render!
In addition to the animations, we had the idea to try and make some music for the video using the logistic map itself! I wrote a little python script to run the algorithm and program a MIDI file, imported into Ableton Live, and tried various time and key signatures...
Let's just say, it embodied chaos!
Chaos Theory Score (unreleased for good reason)